Explore results
Qseek writes the detections as JSON, CSV and Pyrocko files into the run directory. You can explore them in the web UI, in Pyrocko Snuffler and Sparrow, or in QGIS.
Web UI
Explore the detections, magnitudes and stations of a run in the browser. To explore a run on a remote machine, give its path as an ssh://user@host/path URL: Qseek copies the detections over SSH and checks for new detections every minute. The remote machine needs SSH access and Python 3, but no Qseek installation.
The web UI opens on port 2213; set another port with --port. The screenshots show the run of the quick start at Campi Flegrei.
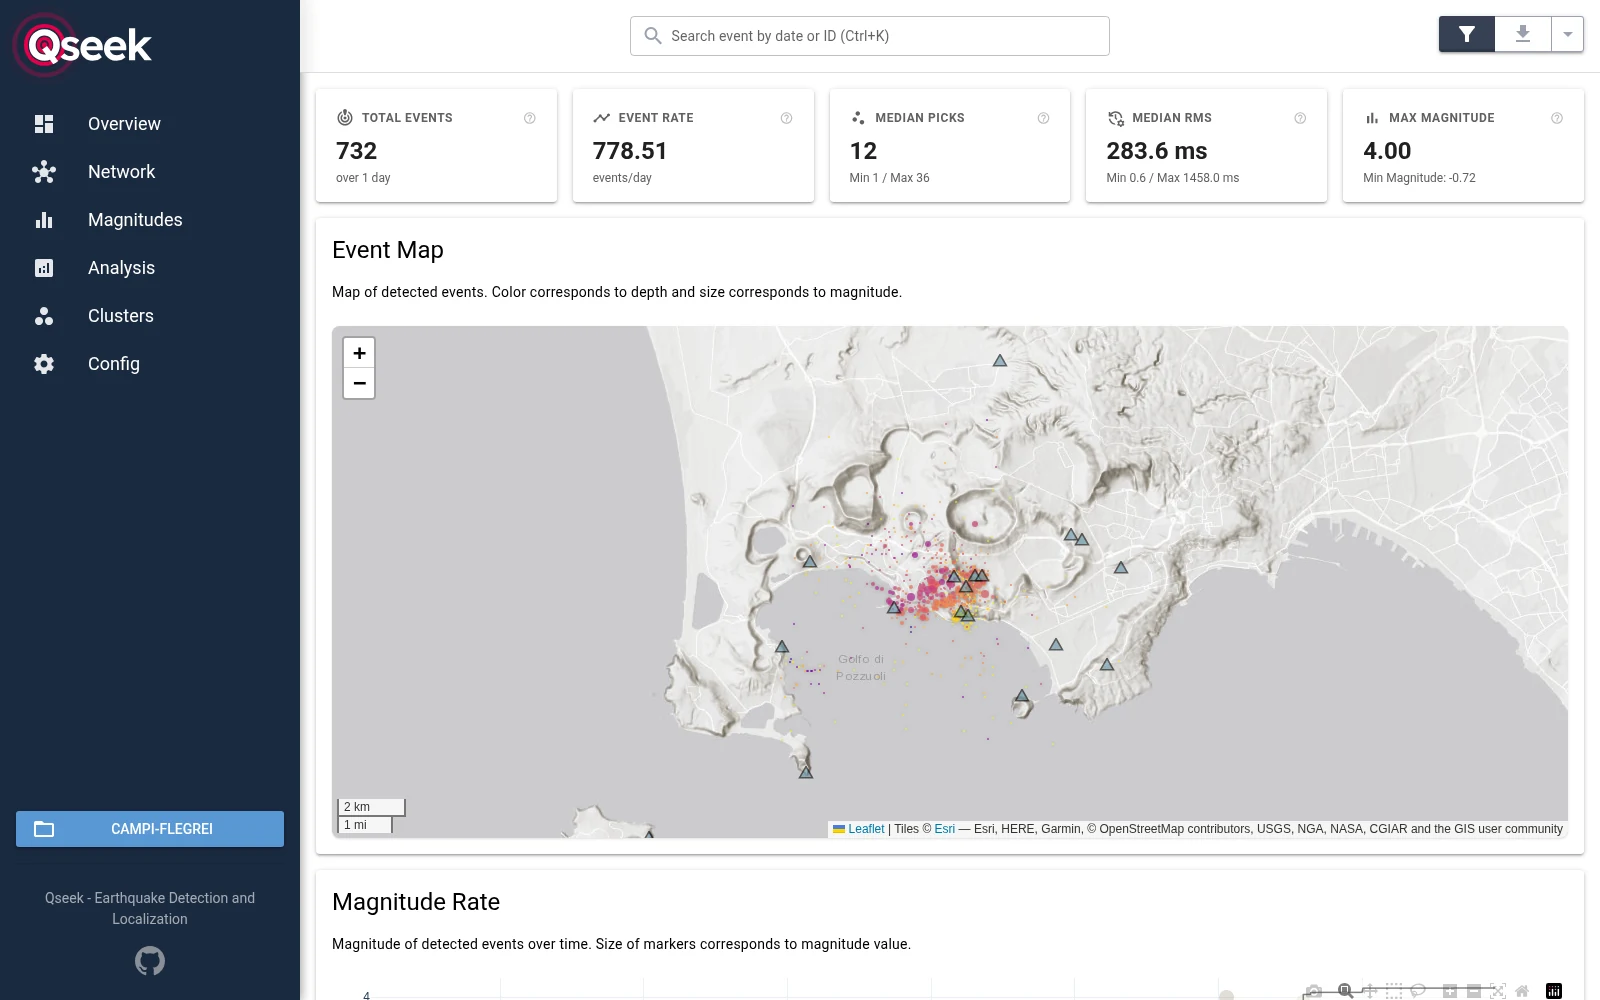
Key numbers of the run and a map of the detections, colored by depth and scaled by magnitude. The triangles are the stations.
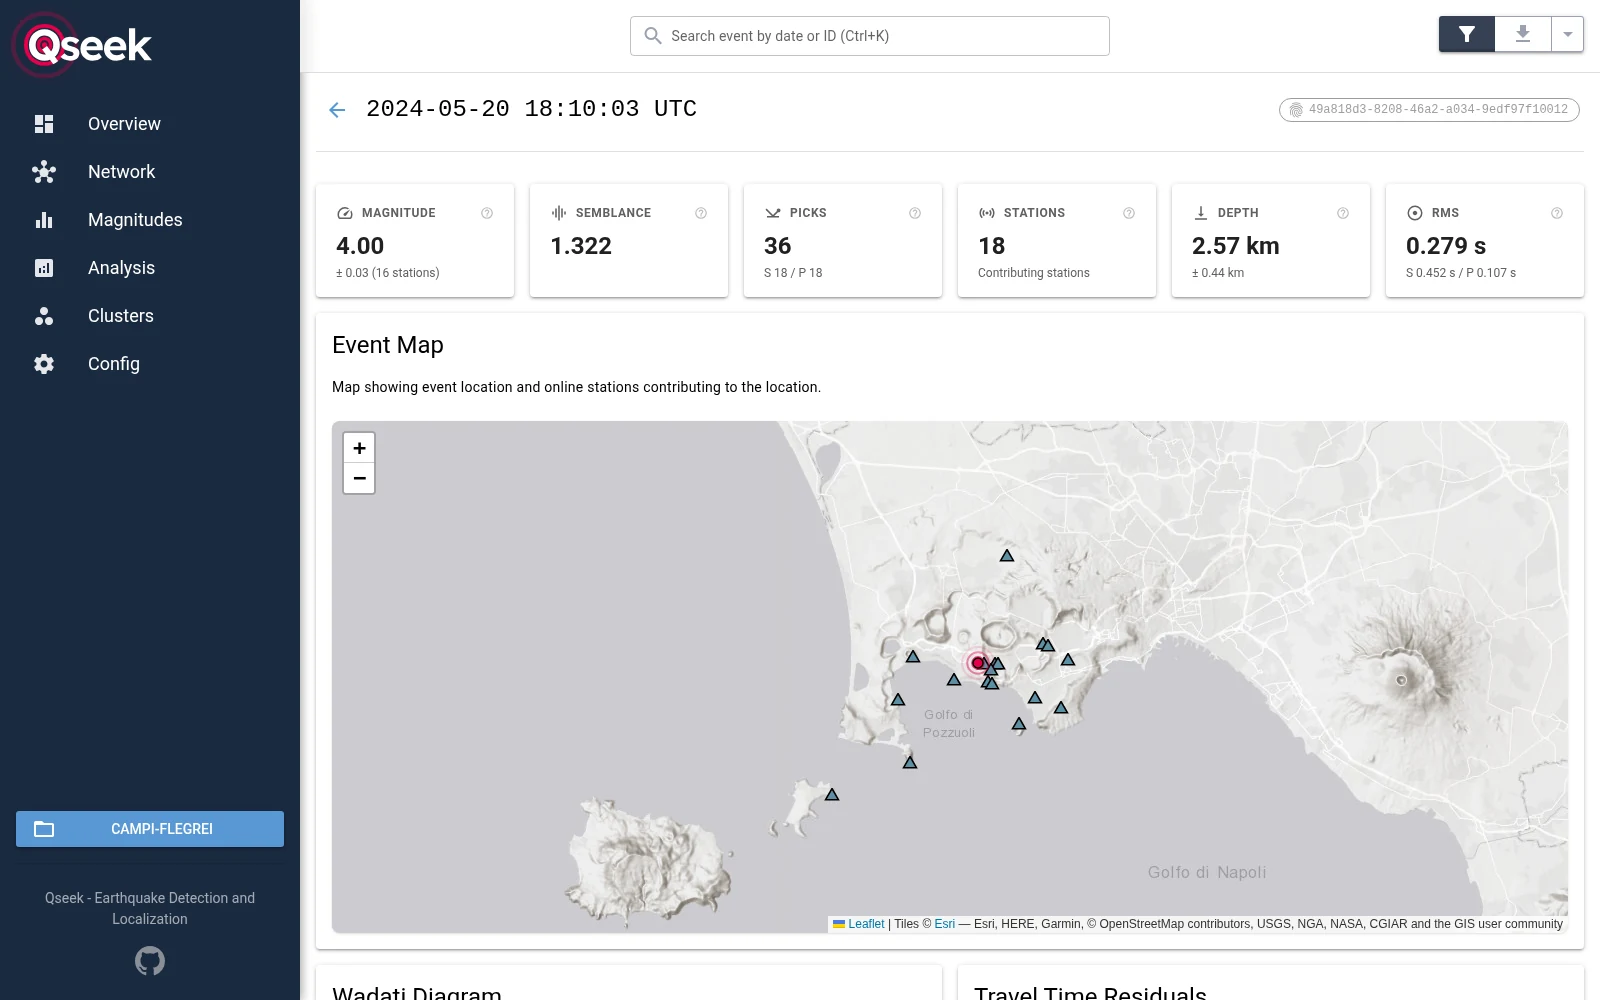
A single detection, here the ML 4.0 event at 18:10 UTC, with its magnitude, picks, depth and residuals, and the stations that contribute to the location.
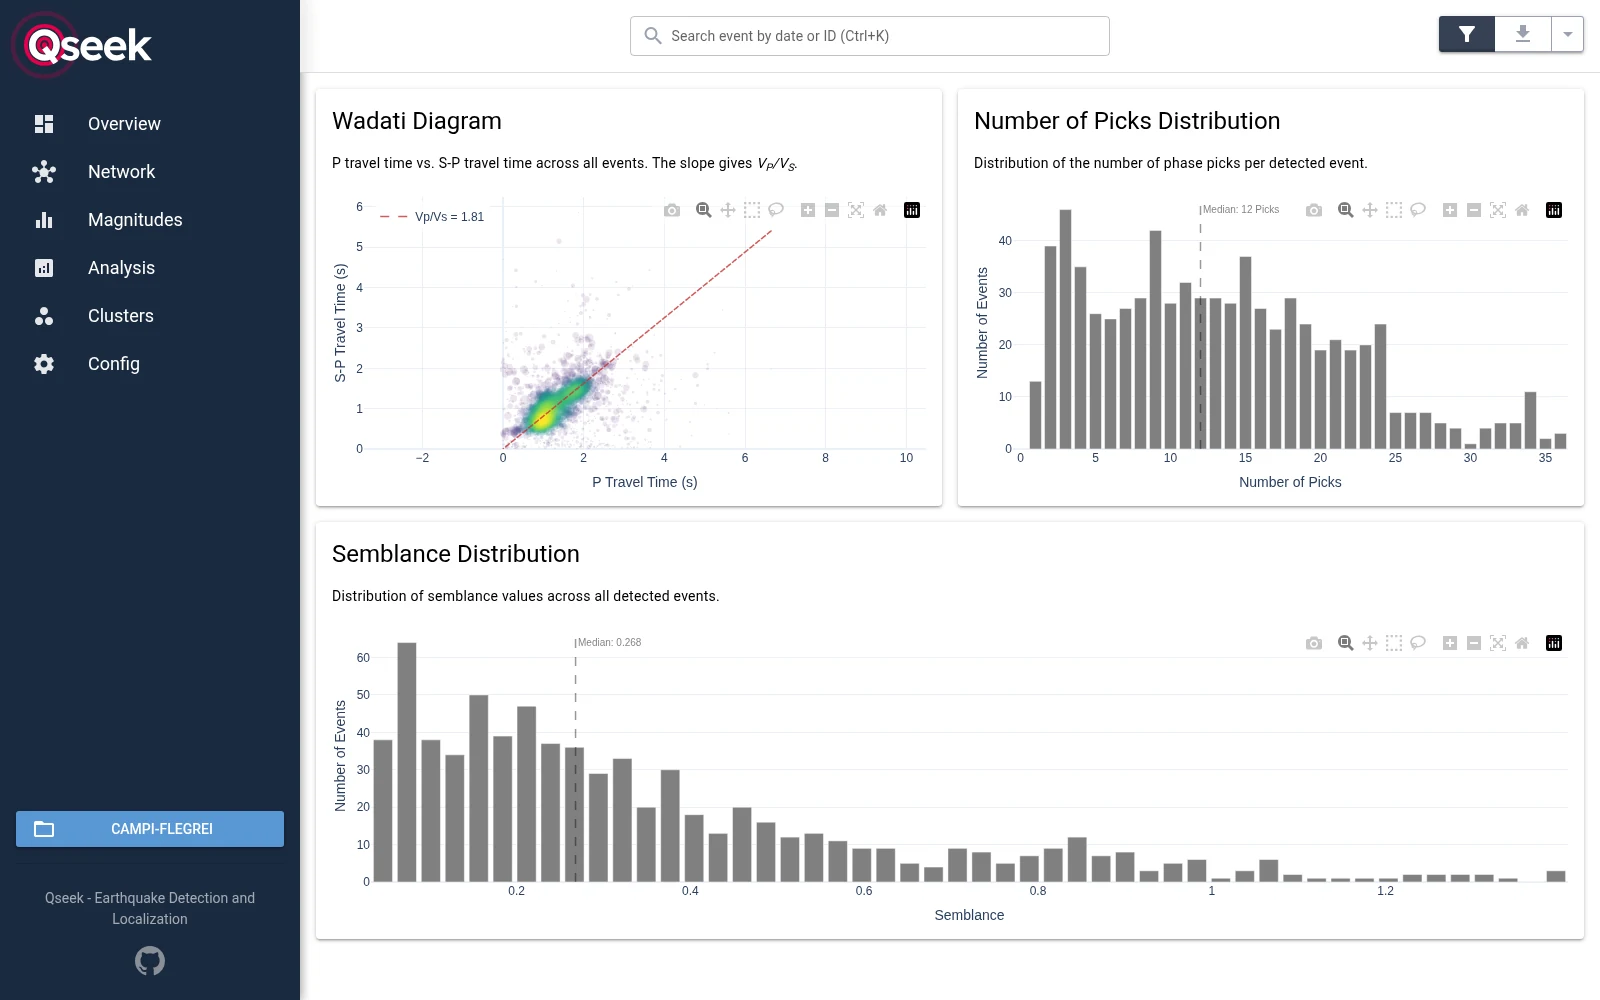
The Wadati diagram with the Vp/Vs ratio, and the distributions of the number of picks and of the semblance.
Search a detection by its date or ID with Ctrl+K. The sidebar leads to the station network, the magnitude statistics, the clusters and the configuration of the run.
Pyrocko Snuffler
Inspect the waveforms together with the detections and the observed and modeled phase picks.
Pyrocko Sparrow
Pyrocko Sparrow shows large sets of detections in 3D, together with the stations and other Pyrocko data. Load pyrocko_detections.list and pyrocko_stations.yaml from the run directory.
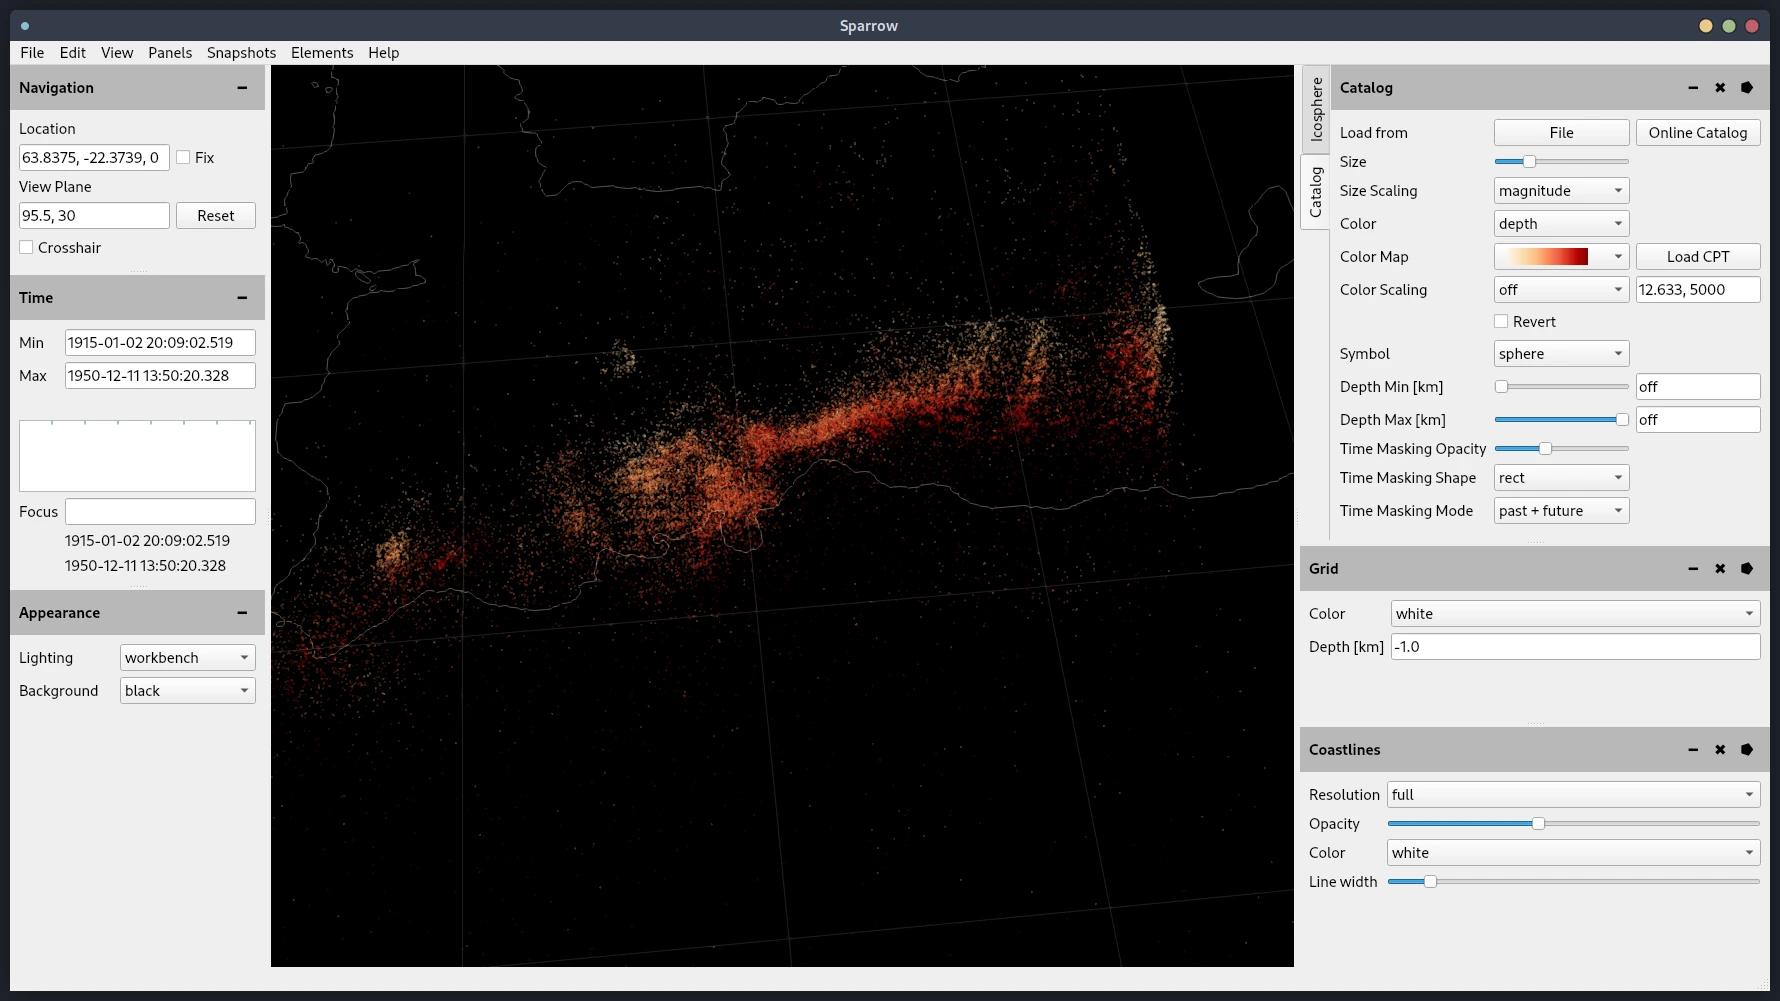
Detections on the Reykjanes Peninsula in Pyrocko Sparrow.
QGIS
QGIS shows the detections on a map, together with your own geodata. Load csv/detections.csv of the run directory as a delimited text layer:
- Open Layer › Add Layer › Add Delimited Text Layer.
- Select
csv/detections.csvas File name. The format is CSV, and the first record has the field names. - Under Geometry Definition, choose Well known text (WKT) with the geometry field
WKT_geom, and the geometry CRS EPSG:4326 - WGS 84. - Click Add.
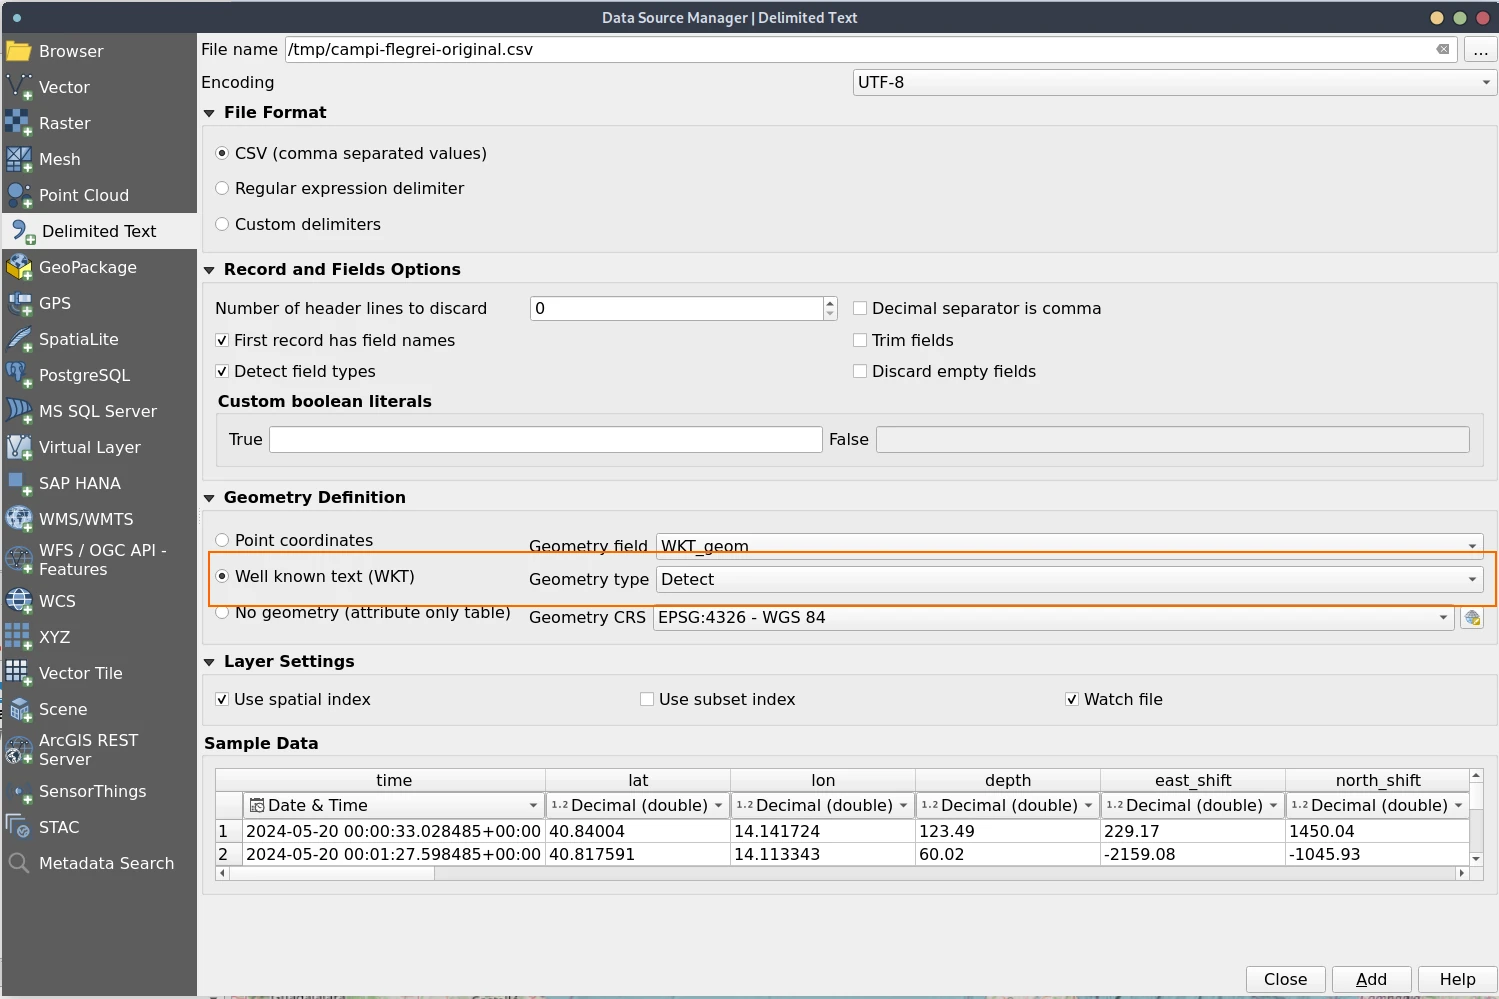
Loading the detections as a delimited text layer in QGIS, with the geometry from the WKT_geom column.
Style the layer by the columns of the detections, e.g. the depth, the semblance or the magnitude. For maps, the csv/detections_jittered.csv file avoids the grid pattern of the octree nodes.
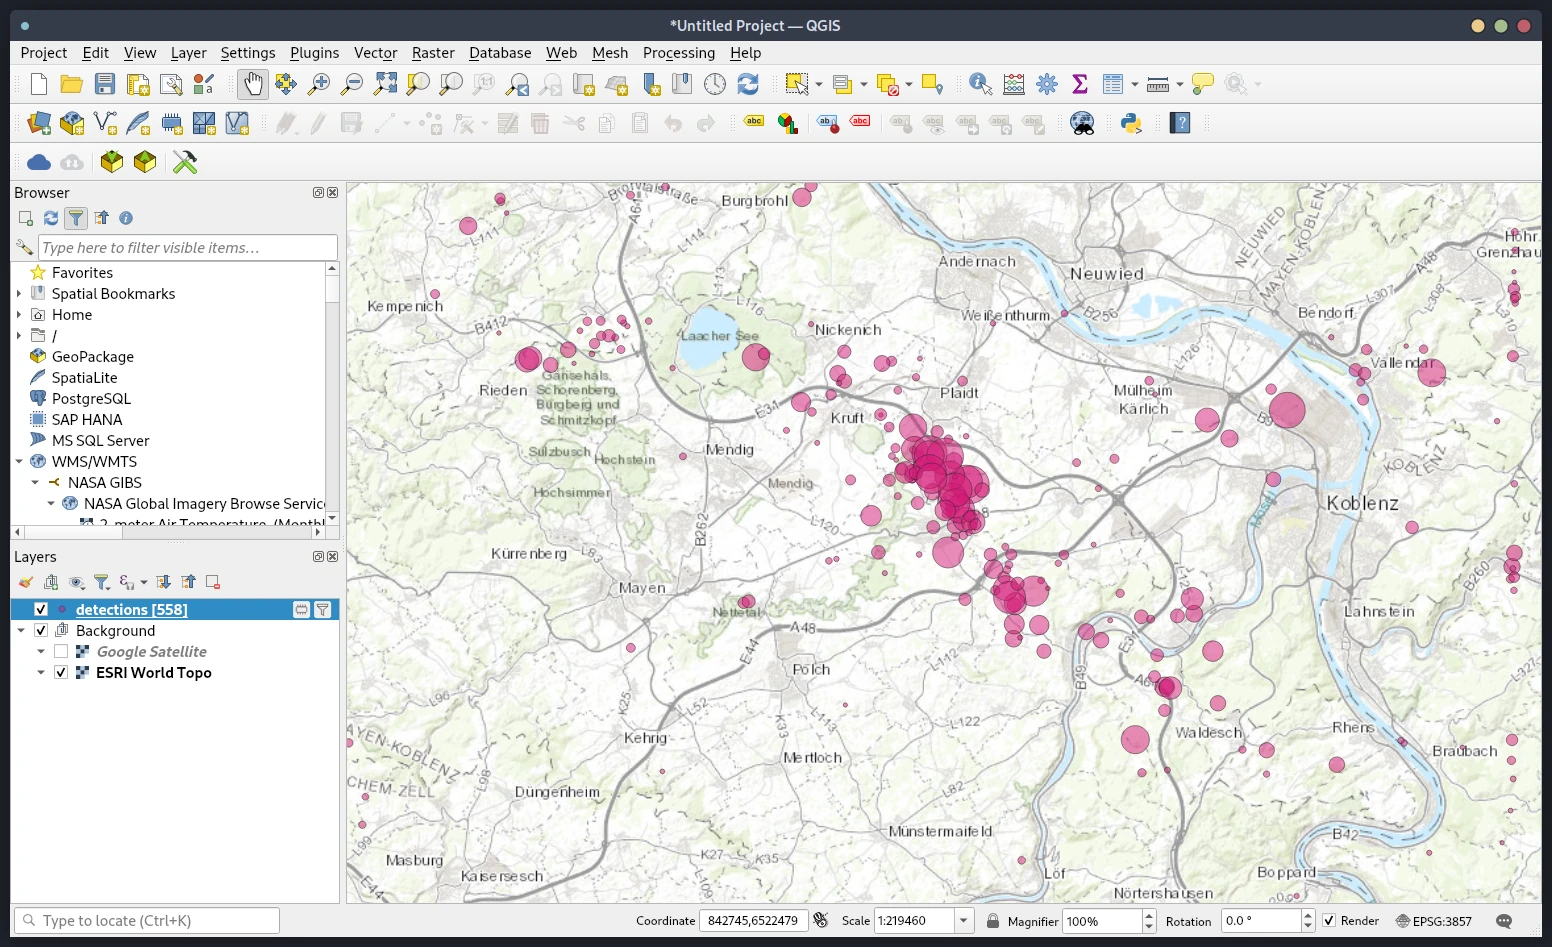
Detections in QGIS, styled by their attributes.
Export detections
Qseek exports the detections to other formats, e.g. a VELEST project for velocity model inversion. See export the detections.