Quick start: Campi Flegrei
In this tutorial you detect and locate the earthquakes of one day at Campi Flegrei, the volcanic caldera west of Naples, Italy. On 20 May 2024, an Md 4.4 earthquake struck the caldera during a swarm. You download the waveforms of the INGV seismic network, set up the search and look at the detected earthquakes.
You need Python 3.12 or newer, about 1 GB of disk space, and a few minutes.
Install
Install Qseek, as described in Installation, and FDSN Rush, which downloads the waveforms:
Create a directory for the project:
Download the data
Write the download configuration for FDSN Rush. It requests one day of waveforms of 19 stations from the INGV FDSN web services:
{
  "writer": {"sds_archive": "sds"},
  "clients": [{"url": "https://webservices.ingv.it/"}],
  "metadata_path": "metadata",
  "time_range": ["2024-05-20", "2024-05-21"],
  "station_selection": [
    "IV.CAAM",
    "IV.CAWE",
    "IV.CBAC",
    "IV.CBAG",
    "IV.CCAP",
    "IV.CFMN",
    "IV.CMIS",
    "IV.CMSN",
    "IV.CMTS",
    "IV.CNIS",
    "IV.COLB",
    "IV.CPIS",
    "IV.CPOZ",
    "IV.CQUE",
    "IV.CSFT",
    "IV.CSOB",
    "IV.CSTH",
    "IV.PTMR",
    "IX.NAPI"
  ],
  "channel_priority": ["HH[ZNE12]", "EH[ZNE12]", "HN[ZNE12]"],
  "min_channels_per_station": 3,
  "max_sampling_rate": 200.0
}
Download the waveforms into an SDS archive in sds/ and the station metadata into metadata/:
The download takes a few minutes and ends with All downloads completed successfully. FDSN Rush prefers the broadband HH channels, falls back to the short-period EH and the strong-motion HN channels, and takes a station only with all three components.
Of the 19 stations, 18 recorded on that day: IV.CAWE had no channels in May 2024, so FDSN Rush skips it. The archive holds about 1 GB of waveforms.
Get the velocity model
Download the 1D velocity model of Campi Flegrei into the project directory: campi-flegrei.nd
The model is in the Pyrocko Cake .nd format. Each line is a depth in km, the P and S velocity in km/s and the density in g/cm³:
    -1.0    1.700  0.950   2.8
     0.0    1.700  0.950   2.8
     0.5    1.838  1.028   2.8
     1.0    2.400  1.344   2.8
     3.0    3.895  2.177   2.8
    10.0    5.624  3.144   2.8
    23.0    6.160  3.457   2.8
mantle
    37.0    8.200  4.600   2.8
Configure the search
Write the search configuration:
{
  "stations": {
    "station_xmls": ["metadata/"]
  },
  "data_provider": {
    "provider": "SDSArchive",
    "archive": "sds/"
  },
  "octree": {
    "location": {"lat": 40.827, "lon": 14.139},
    "root_node_size": 1000.0,
    "n_levels": 4,
    "east_bounds": [-6000.0, 6000.0],
    "north_bounds": [-6000.0, 6000.0],
    "depth_bounds": [0.0, 6000.0]
  },
  "image_function": {
    "image": "SeisBench",
    "model": "PhaseNet",
    "pretrained": "volpick",
    "phase_map": {"P": "fm:P", "S": "fm:S"}
  },
  "ray_tracers": [
    {
      "tracer": "FastMarching",
      "velocity_model": {"filename": "campi-flegrei.nd"},
      "phases": ["fm:P", "fm:S"]
    }
  ],
  "magnitudes": [
    {"magnitude": "LocalMagnitude", "model": "campi-flegrei"}
  ]
}
- Stations and waveforms: the StationXML files in
metadata/and the SDS archive insds/, both from FDSN Rush. - Search volume: a 12 km × 12 km × 6 km volume, centered on the caldera. The 1 km root nodes are refined over 4 levels down to 125 m.
- Image function: PhaseNet with the
volpickweights. We compared theoriginal,volpickandinstanceweights on this day:volpickgave the fewest weak detections and the most phase picks per event. - Travel times: the fast marching ray tracer calculates the P and S travel times in the velocity model. The
phase_mapassigns the P and S images of PhaseNet to its phasesfm:Pandfm:S. - Magnitudes: local magnitudes with the attenuation model of Campi Flegrei (Petrosino et al., 2008).
Everything else keeps its default; the configuration overview explains all fields.
Run the search
Qseek prepares the travel times, then processes the day in windows of 5 minutes. On a workstation with an NVIDIA GeForce RTX 4060, the search takes about 100 seconds; without a GPU it takes longer. The search ends with:
Two warnings are expected for this data: IV.CCAP has gaps on that day, and the smallest events have too few stations within the 8 km range of the magnitude model for a local magnitude.
Look at the results
The search writes its results into the run directory campi-flegrei/. Qseek detected 732 events on 20 May 2024; 521 of them have at least eight phase picks. 298 detections have a local magnitude, from ML −0.7 to 4.0.
The INGV event catalog lists 45 earthquakes within 0.1° of the caldera on that day, from Md 1.0 to the Md 4.4 main shock. Qseek detects all 45 of them. Its epicenters are a median 241 m from the INGV locations, its depths a median 141 m.
In the web UI
Open the run in the browser:
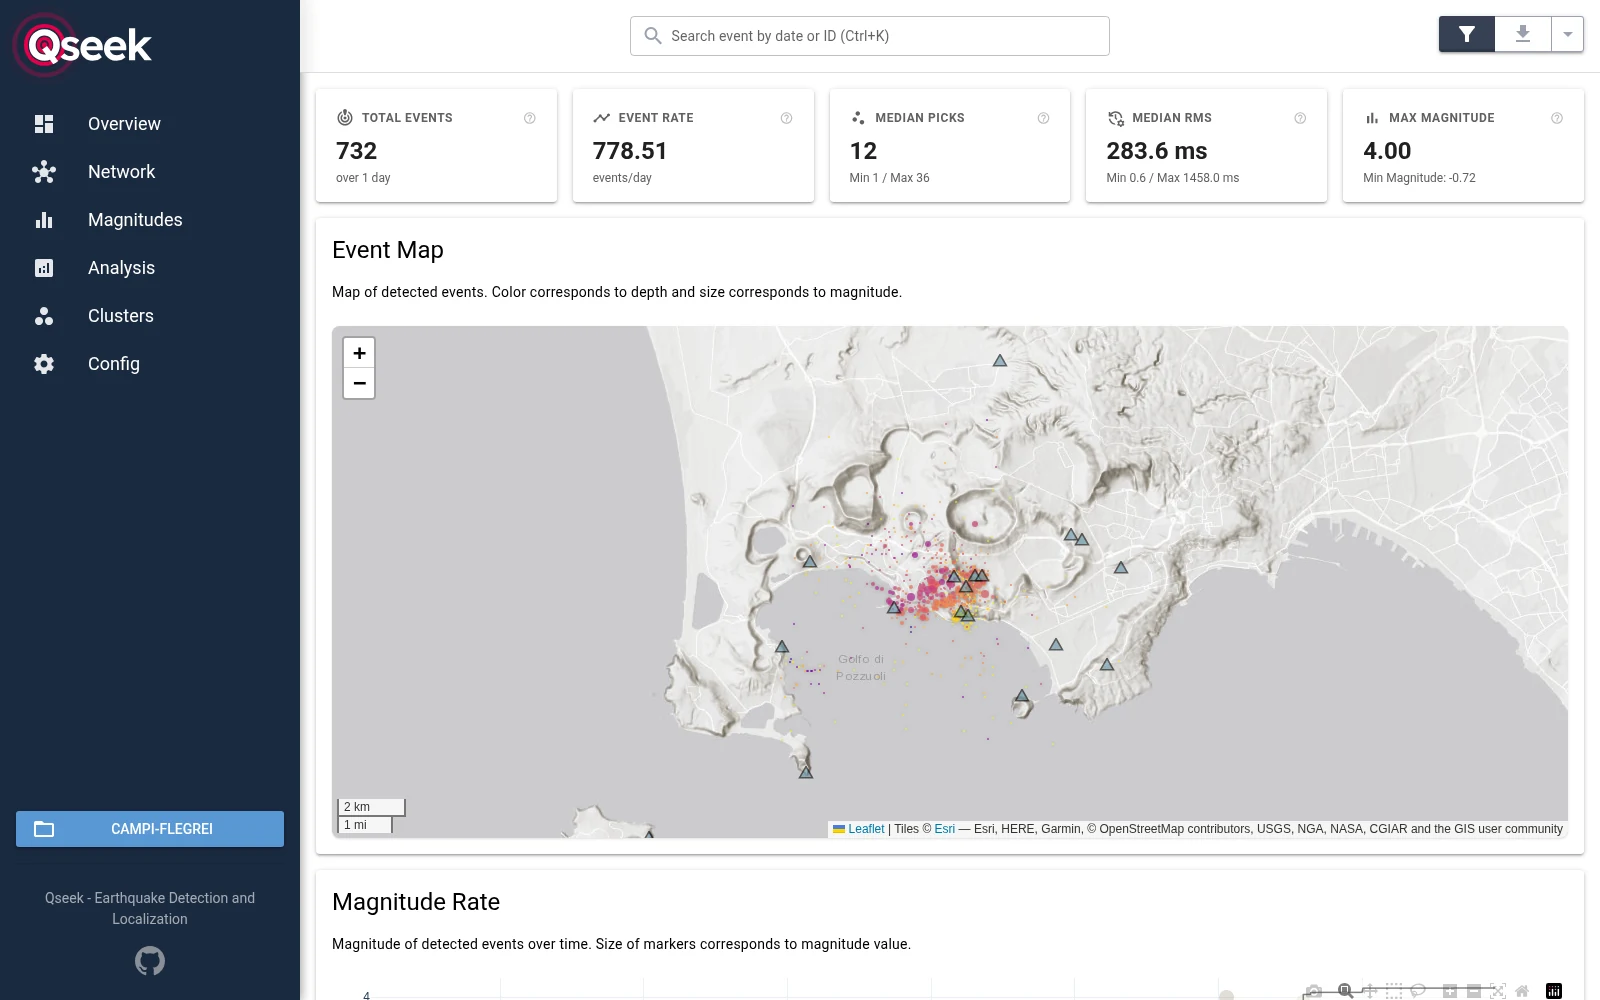
The overview of the run: 732 detections, colored by depth and scaled by magnitude. The triangles are the 18 stations.
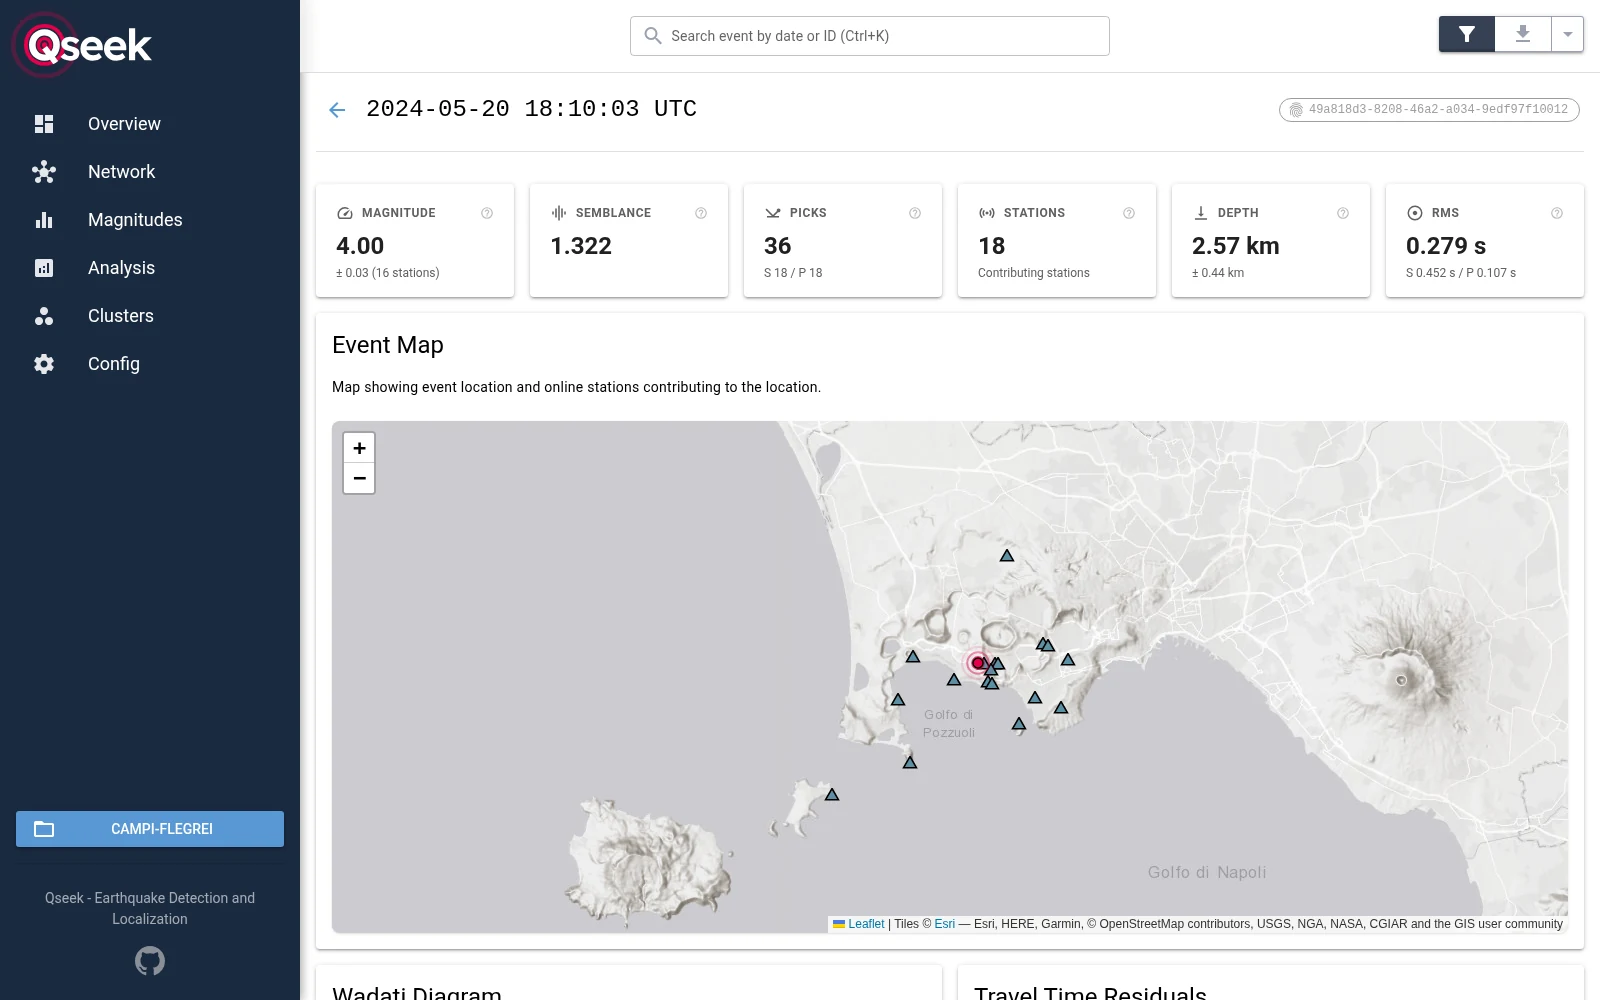
The strongest detection, ML 4.0 at 18:10 UTC, located at 2.57 km depth with 36 picks at 18 stations.
The web UI also shows the magnitude statistics, a Wadati diagram and every single detection.
In QGIS
Load campi-flegrei/csv/detections.csv into QGIS as a delimited text layer, with the geometry from the WKT_geom column. Explore results walks you through it.
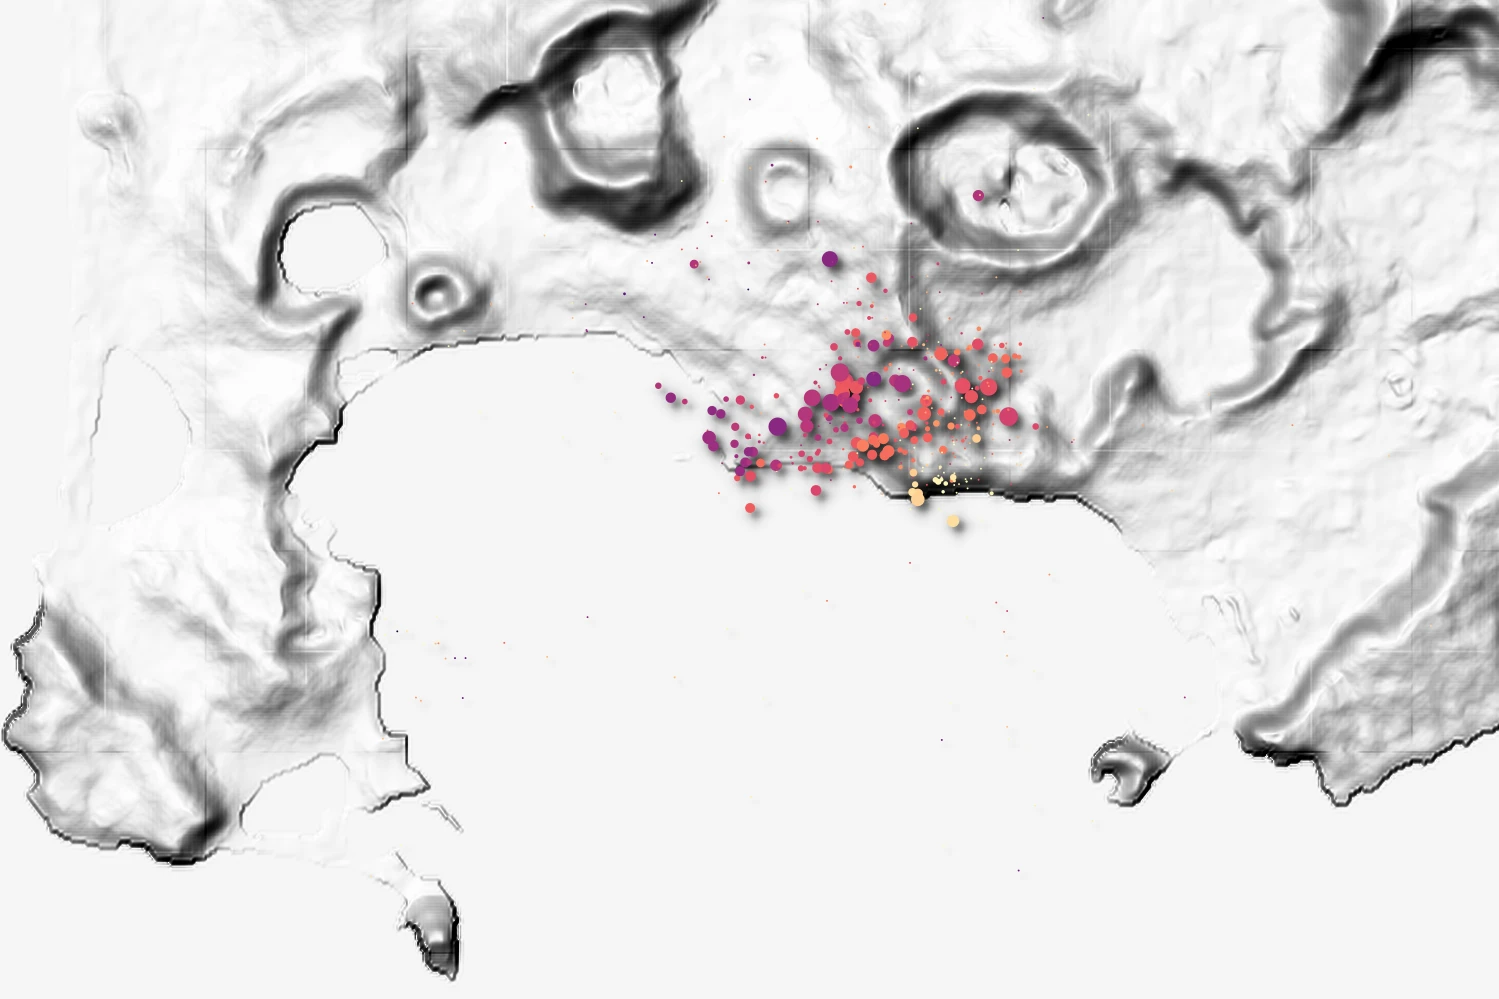
The detections of this tutorial in QGIS, on a hillshade of Campi Flegrei. The symbol size shows the semblance, the color the depth: light colors are shallow, dark colors deep.
With the waveforms
Inspect the picks and the waveforms of the detections in Pyrocko Snuffler:
Next steps
- How Qseek works explains the steps of the search.
- Tune the detection shows how to check and improve the results.
- Station corrections refine the locations in a second search.